AN235279 Performing ETM and ITM trace on PSoC™ 6 MCU

About this document
Scope and purpose
The application note introduces the trace features of the PSoC™ 6 MCU and the supporting software tools. This application note helps you get started with performing instruction (ETM) and instrumentation (ITM) tracing on PSoC™ 6 MCUs. A sample project is configured using ModusToolbox™ and exported to third party tools like IAR Embedded Workbench and Keil μVision to perform trace. The application note also guides you to more features of trace and other resources available online to accelerate your learning.
If you are new to PSoC™ 6 MCU and ModusToolbox ™ software environment, see AN228571 - Getting started with PSoC™ 6 MCU on ModusToolbox™ software.
Intended audience
The application note is intended for advanced engineers who want to use the trace capabilities of the PSoC™ 6 MCU.
Introduction
What is trace?
As per Arm®’s definition, ‘trace’ refers to the process of capturing data that illustrates how components in a design are operating, executing, and performing. In simple words, trace helps you capture and visualize the operations that are occurring inside the MCU, generally in a non-intrusive way.
There are several types of trace; for each type, usually a separate trace generation component is implemented in the MCU. Trace can be broadly classified as follows:
- Instruction trace
- Data trace
- Instrumentation trace
- System trace
Although the scope of this application note is limited to instruction and instrumentation trace, the approach can be extended to perform data and system trace as well.
Instruction trace generates information about the instruction execution of a core or processor. Embedded Trace Macrocell (ETM) is one such example for instruction trace source.
Instrumentation trace outputs data collected from several hardware (for example, Data Watchpoint and Trace unit - DWT) and software sources (for example, 32-bit stimulus registers). Data from the instrumentation trace can be output using printf-style debugging. Instrumentation Trace Macrocell (ITM) is used to capture the instrumentation trace data.
Why is trace important?
Designing a complex embedded system efficiently depends directly on the ability to precisely debug the issues that appear during development. The trace technique has the major benefit of its being non-intrusive compared to other debugging techniques. It means that trace can be used to fetch all the instructions running in the core without affecting the actual application flow. Not only instructions, other system-level information and data can be analyzed without halting the processor or adding extra lines of code.
Along with the cycle count information and timestamps, the trace data can also be used to profile the code and measure performance at function level.
See the Non-intrusive debugging with ETM trace article from IAR Systems for a good illustration of the importance of trace.
Overview of subsequent chapters
The subsequent chapters in this application note will speak about the overview of Arm® trace architecture and its implementation in PSoC™ 6 MCUs. The hardware and software requirements for performing trace on PSoC™ 6 MCUs are listed. Later sections describe how to import an existing PSoC™ 6 MCU project in ModusToolbox™ and enable trace from ModusToolbox™. Finally, steps on exporting a ModusToolbox™ project, editing the debugger scripts, and performing trace on third party tools like IAR Embedded Workbench and Keil μVision are shown.
General and PSoC 6 MCU Arm trace architecture
General trace architecture
Trace components can be mainly classified into three types:
Trace Source: A component which generates trace data; for example: ETM, ITM
Trace Sink: A component which stores or outputs the trace data; for example: Embedded Trace Buffer (ETB), Embedded Trace FIFO (ETF), Trace Port Interface Unit (TPIU), Serial Wire Output (SWO)
Trace Link: A component which links trace or non-trace components together; for example: Funnel, Replicator, Cross Trigger Interface (CTI).

Trace Source
Although there are many trace source components, the scope of this application note is limited to ETM and ITM components.
Embedded Trace Macrocell (ETM)
The ETM component allows instruction and data trace. The ETM block is configurable during chip design; you can omit data trace if not required.
At a high level, ETM does not generate a trace packet for every instruction the CPU executes. It only outputs information about the instruction flow (jump or no jump) and sometimes outputs the full destination address (when there is a branching instruction). The debug host will generally have a copy of the application image; therefore, using the data from the ETM component, the complete program execution can be reconstructed. As CPU speeds are usually higher, the ETM block needs to compress the instruction execution data and packetize it before sending it to a trace sink.
Between the ETM block and a trace sink, a FIFO buffer is usually provided to allow sufficient time for the trace sink to process and route the trace data.
ETM data also includes time-stamps; this can be used to determine the time consumed by code or functions. Function profiling is very useful in optimizing the regions of your code which is consuming a lot of CPU bandwidth.
Instrumentation Trace Macrocell (ITM)
The ITM component is an application-driven trace source. The data for ITM can come from several sources.
- Software source – The application can write directly to the ITM stimulus registers to generate packets. An example use case is sending out raw ADC data, which can be plotted and visualized at the debug host.
- Hardware source – The DWT block has data watchpoints, data trace, debug event, and profiling counters. The data from these debug systems can be routed through ITM.
- Timestamps – A counter in the ITM provides a timestamp for each trace packet.
Micro Trace Buffer (MTB)
The MTB component allows basic instruction trace. During a trace operation, the debugger can configure the MTB to allocate a small portion of the SRAM as a trace buffer for storing the trace information. The SRAM can be a dedicated or a shared one (system SRAM used by the CPU). When a branching instruction occurs or if the program flow changes due to interrupts, the MTB stores the source and destination PC (program counter) information. The MTB is mostly used in circular buffer mode: when the allocated memory is full, the oldest branch information is overwritten by a new branch information.
Trace Sink
Similar to the trace source, there are many trace sink components. The scope of this document is limited to ETB, ETF, TPIU, and SWO.
Embedded Trace Buffer (ETB)
The ETB is a dedicated SRAM that stores generated trace data on-chip for later retrieval and analysis. The SRAM acts like a circular buffer that wraps when the buffer size limit is reached. Buffer wrapping works by replacing the oldest trace data with the newest data.
Embedded Trace FIFO (ETF)
The Embedded Trace FIFO (ETF) contains a dedicated SRAM that can be used as either a circular buffer, a hardware FIFO, or a software FIFO. In circular buffer mode, the ETF has the same functionality as the ETB. In hardware FIFO mode, the ETF is typically used to smooth out fluctuations in the trace data. In software FIFO mode, on-chip software uses the ETF to read out the data over the debug AMBA Peripheral Bus (APB) interface.
Trace Port Interface Unit (TPIU)
The TPIU routes the trace data to external pins. A debugger is connected to these external pins to capture the trace data. The TPIU also adds source identification information into the trace stream so that trace can be re-associated with its trace source.
Usually, four data pins and one clock pin are associated with the TPIU component. This is a design-time configuration and can be changed per need. If the TPIU block has connection to four data pins, it is not necessary to use all the four pins to output the trace data. In this case, the TPIU can be configured to be used in 1-bit, 2-bit, or 4-bit mode.
Serial Wire Output (SWO)
The trace data from the source is directly passed to an external debugger using a single-wire output called SWO. Owing to the trace bandwidth required, the single-pin SWO is not suitable for outputting the ETM trace data; it is mainly used to pass the ITM data.
Trace Link
Funnel
The funnel merges multiple AMBA Trace Bus (ATB – bus that carries data from trace sources) into a single ATB. Then the single ATB can be routed to a trace sink, replicator, or another trace funnel.
Replicator
The ATB that comes out of the funnel can be split into multiple ATBs using a replicator. This allows the trace data to be routed to multiple sinks.
Cross Trigger Network (CTI)
The CTI is used to generate and route triggers between different trace components. For example, the ETB can send a trigger to the ETM block to halt the CPU when the buffer is full.
Trace output
As discussed earlier, trace data is bandwidth-intensive, and therefore needs compression/encoding before converting to packets. Therefore, the trace data is not directly in a human-readable format. The trace data when captured by a debugger is decompressed/decoded and processed to convert it to a human-readable format. Sometimes, when transmitting raw data through the ITM, the trace packets can directly have the raw data without encoding.
The trace data can be captured in two ways by a debugger:
- On-chip capture
- Off-chip capture
On-chip capture
In this scenario, the trace data is usually stored in the ETB. At particular points during debugging, the external debugger performs operations to extract the on-chip trace data using a 2-pin serial wire debug (SWD).

Off-chip capture
In this scenario, the trace data is routed to an external debugger in real time using the TPIU and SWO pins. The debugger then processes the data and displays it in a human-readable format. The scope of this application note is mainly to learn this mode of trace capturing.

Trace infrastructure examples
Trace components are highly design-configurable; the choice of components to use is also left to the MCU vendors. This section shows a few trace infrastructure examples that can be implemented during design.
Single-core, off-chip ETM trace example
In this example, the ETM is used to generate both instruction and data traces for the core. The ETF is used to buffer the data before sending the data to the TPIU component. The TPIU component then forwards the data to the external debugger in real time using the data and clock TPIU pins.

Multi-core, off-chip ETM trace example
In this example ETM data from multiple cores is merged to one ATB using the funnel. The data from the funnel is then routed through the ETF, TPIU, and finally to the debugger.

Multi-core, off-chip ETM CTI trace example
This example is similar to the previous multiple-core example, except that now triggers are routed between different trace components. For example, the ETF can send a halt request to the cores if the FIFO memory starts to overflow. The halt request halts the cores, which allows the debugger to collect the trace data; then the ETF sends a resume request to start the cores back once the FIFO has free space.

PSoC 6 MCU trace infrastructure
PSoC™ 6 MCU is a dual-CPU microcontroller with Arm® CM4 and CM0+ cores.
The CM4 core supports a 4-bit ETM and an ITM as trace sources. It supports a TPIU port (4 data pins, 1 clock pin) and a SWO pin for outputting the trace data to the external debugger. The SWO pin is multiplexed with the JTAG interface; both cannot be used simultaneously. The TPIU pins can be routed to multiple I/O ports on PSoC™ 6 MCU; see the device datasheet for details.
The CM0+ CPU supports the MTB with 4-KB dedicated SRAM. This application note does not cover MTB tracing.
PSoC™ 6 MCU also has an Embedded Cross Trigger (also called CTI) for synchronized debugging and tracing of both CPUs.

Hardware and software requirements
This section will list the hardware and software requirements to perform hands-on trace on PSoC™ 6 MCUs.
Hardware requirements
Trace probes (external debugger)
The flow in this application note uses two trace probes:
I-jet Trace for Arm® Cortex® -M – The I-jet trace probe is used with IAR Embedded Workbench software tools.
ULINKpro Debug and Trace Unit – The ULINKpro trace probe is used with Keil μVision software tools.
Development board
The flow in this application note uses the CY8CEVAL-062S2 evaluation kit. Usually on the evaluation kits, due to limited I/Os, the trace pins are multiplexed with other peripherals. Open the CY8CEVAL-062S2 schematics file, search for the term “trace”. You will find a box named “Trace multiplexed pins” as shown below:
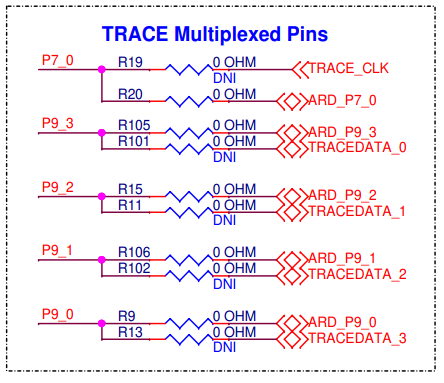
In this kit, the trace pins are multiplexed to the Arduino port pins. The trace pins must be exposed to the J22 ETM header by doing the following:
- Unload the resistances R20, R105, R15, R106, and R9.
- Load zero-ohm resistances to R19, R101, R11, R102, and R13.
- Solder on the ETM header (20-pin FRC male connector).
Software requirements
The flow in this application note uses the following software tools:
ModusToolbox™ software – ModusToolbox™ 3.0 is required to create/import a project for PSoC™ 6 MCUs. The tool is also used to export the project to third party tools.
IAR Embedded Workbench for Arm® – IAR EW (tested with v8.42.2) and I-jet trace can be used to perform trace on PSoC™ 6 MCUs.
Keil μ Vision – μVision (tested with v5.36) and ULINKpro can be used to perform trace on PSoC™ 6 MCUs.
Performing trace on PSoC 6 MCU
Creating/importing project using ModusToolbox
As ETM and ITM are supported only on the CM4 core of the PSoC™ 6 MCU, the application note will use a single-core project for trace demonstration. The following steps explain how to import the PSoC™ 6 MCU Empty App code example to Eclipse IDE for ModusToolbox™ and configure the project to reserve resources for trace:
Launch Eclipse IDE for ModusToolbox™ 3.0 or later and select a workspace.
From the Quick Panel, click New Application.
Once the project creator wizard opens, expand PSoC™ 6 BSPs and select CY8CEVAL-062S2. Click Next.
In the new window, expand Getting Started and select Empty App. Click Create.
Once the application is loaded in the Project Explorer, select the application folder. From the Quick Panel, launch Device Configurator.
In the Device Configurator, select the System tab. Select Debug under Resources.
Edit the debug parameters as shown in the following figure to reserve resources for performing trace. This step is required only to reserve the resources, so that they are not accidently assigned to some other peripheral by the HAL hardware manager. The configuration of the same resources is actually done by the third party debugger scripts.
When selecting the trace pins and clock divider, make sure to pick the resources that are defined in the BSP and have aliases starting with
CYBSP_. The pins defined in the BSP will match the pins as seen in the Development board section. If you wish to choose some other resources, make sure that the third party debugger scripts also configure the same resources.Figure 9. CY8CEVAL-062S2 kit trace pin schematics 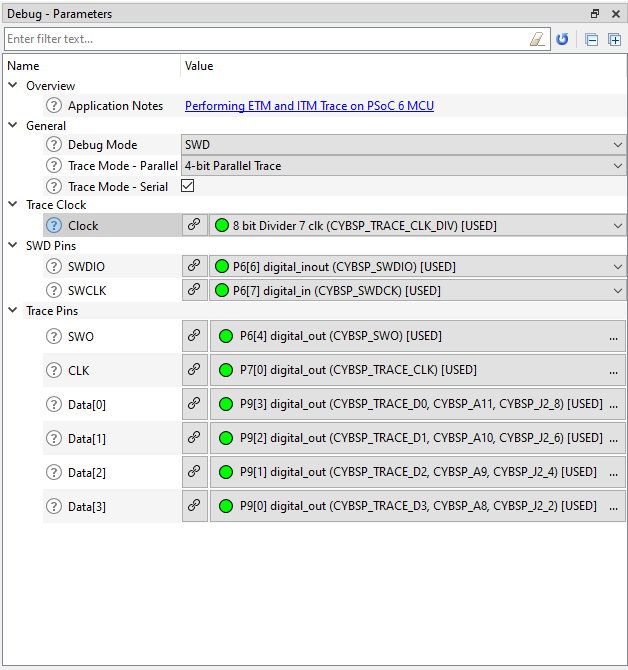
- Click . Close the Device Configurator.
For detailed steps on creating a new project in Eclipse IDE for ModusToolbox™, see AN228571 - Getting started with PSoC™ 6 MCU on ModusToolbox™ software.
Performing trace on IAR Embedded Workbench
Import the ModusToolbox project into IAR EW
To export the project from ModusToolbox™ to IAR EW, do the following:
- Open modus-shell and navigate to the Empty App application directory.
- Run the following command:
make ewarm8 TOOLCHAIN=IAR
To import the project into IAR EW, do the following:
- Start IAR Embedded Workbench.
- On the main menu, select and click OK.
- Browse to the Empty App application directory, enter a desired application name, and click Save.
- After the application is created, select . Then, enter a desired workspace name.
- Select and click OK.
- On the Select IAR Project Connection File dialog, select the
.ipcf file and click Open.
The project will be created in the workspace window.
- Right-click the project and click Make to build it.
Configure the debugger script and debugger
The debugger configures the TPIU port and necessary clocks before starting the trace. This configuration is done through functions listed in a debugger script. The debugger scripts for PSoC™ 6 MCUs are located in the IAR EW installation directory: <IAR Installation path> \Embedded Workbench 8.4\arm\config\debugger\Infineon\PSoC6. The debugger scripts have the .dmac extension.
The debugger scripts have default values for the TPIU port and clock divider selection. The default value for the TPIU port is usually not applicable for all development kits. Therefore, the script file must be edited to choose the correct TPIU port.
The CY8CEVAL-062S2 evaluation kit uses the CY8C62xA PSoC™ 6 MCU device. Open the CY8C6xxA_CM4.dmac debugger script from the IAR EW installation directory (<IAR Installation path> \Embedded Workbench 8.4\arm\config\debugger\Infineon\PSoC6). In the file, search for the _TRACE_path parameter.
The _TRACE_path parameter in the script determines the GPIO port to configure before starting trace. The parameter and its comment are as shown below:

As seen in the Development board section, the trace data pins are routed to Port 9 of the kit. Therefore, the default value of 0x0001 for the _TRACE_path parameter is not correct in this case and must be modified.
Do the following to override the parameters values in the debugger script without editing the file directly:
- In the IAR EW, go to and select Use command line options.
- In the text box, enter the following:
macro_param _TRACE_path=0x1111
Note that this command is space-sensitive; extra spaces shouldn’t be added around the equals sign.
You can modify any other parameter in the script in a similar way if required. For the flow followed in this application note, modifying the trace path is sufficient.
To select the debugger, in the IAR EW, go to and select I-jet under the Driver drop-down.
Perform ETM trace
In the main.c file, modify the main function as shown below. This will toggle the user LED on the kit every second.
Code Listing 1
int main(void)
{
  cy_rslt_t result;
  /* Initialize the device and board peripherals */
  result = cybsp_init() ;
  if (result != CY_RSLT_SUCCESS)
  {
    CY_ASSERT(0);
  }
  __enable_irq();
  /* Initialize the User LED */
  result = cyhal_gpio_init(CYBSP_USER_LED, CYHAL_GPIO_DIR_OUTPUT,
                           CYHAL_GPIO_DRIVE_STRONG, CYBSP_LED_STATE_OFF);

  /* GPIO init failed. Stop program execution */
  if (result != CY_RSLT_SUCCESS)
  {
    CY_ASSERT(0);
  }
  for (;;)
  {
    cyhal_system_delay_ms(1000);

    /* Invert the USER LED state */
    cyhal_gpio_toggle(CYBSP_USER_LED);
  }
}
To start the ETM trace, do the following:
- Click the Download and Debug icon on the IAR EW toolbar to program the image and start the debug perspective.
- Select . The ETM trace window appears.
- Right-click the ETM trace window and click Enable.
- Click the Go icon on the toolbar to start the execution and collect the ETM trace data.
You should see the user LED toggling every second. The following is a snapshot from the debug log window:

The trace calibration detects a clock of 4 MHz before entering the main function. This is because the debug scripts configure only the clock divider and not the FLLs/PLLs that generate the high-frequency peripheral clock from the internal main oscillator (IMO – 8MHz). Therefore, when the code just starts executing from the beginning of the main function, the FLLs/PLLs are disabled and the IMO is routed directly to the high-frequency clock. The debugger will by default apply a divide by 2 value on the clock, giving 4 MHz.
Once the code executes the cybsp_init() function, the FLLs/PLLs are
enabled and the high-frequency peripheral clock will now have a value of 100
MHz. The debugger will now see a different clock and stops trace. The logs
highlighted in the previous Debug log window reports the same.
The ideal way to trace is to put a breakpoint right after the cybsp_init()
function. Once the breakpoint is hit, trace stops. Now if you restart the trace, the
debugger will recalibrate to the new frequency and start capturing the data correctly. See
the following snapshot from the debug log window:

If you pause the trace, the trace data collected will be populated in the ETM Trace window as shown below:

Perform ITM trace (printf-style debugging)
- In IAR EW, go to and select Serial (SWO) under the Mode drop-down list. Uncheck the Allow ETB checkbox.
- Go to . Select Semihosted, Via SWO and select the Use CMSIS checkbox.
In the main.c file, modify the main function and header list to
include the
printf statement as shown below:
Code Listing 2
#include "cy_pdl.h"
#include "cyhal.h"
#include "cybsp.h"
#include "stdio.h"

int main(void)
{
  cy_rslt_t result;

  /* Initialize the device and board peripherals */
  result = cybsp_init() ;
  if (result != CY_RSLT_SUCCESS)
  {
    CY_ASSERT(0);
  }

  __enable_irq();

  /* Initialize the User LED */
  result = cyhal_gpio_init(CYBSP_USER_LED, CYHAL_GPIO_DIR_OUTPUT,
                           CYHAL_GPIO_DRIVE_STRONG, CYBSP_LED_STATE_OFF);

  /* GPIO init failed. Stop program execution */
  if (result != CY_RSLT_SUCCESS)
  {
    CY_ASSERT(0);
  }

  int i = 0;

  for (;;)
  {
    cyhal_system_delay_ms(1000);

    /* Invert the USER LED state */
    cyhal_gpio_toggle(CYBSP_USER_LED);

    printf("Hello empty project - %d\n", i++);
  }
}
To start the trace, do the following:
Click the Download and Debug icon on the IAR EW toolbar to program the image and start the debug perspective.
Go to . Make the ITM Stimulus Ports configuration as follows:
Figure 14. IAR SWO configuration for ITM - Go to View tab and select Terminal I/O. A terminal I/O window will open; this is where you will see the print messages.
- Click the Go icon on the toolbar to start the execution and collect ITM data.
You should see the user LED toggling every second. The Terminal I/O window should display logs as shown below:
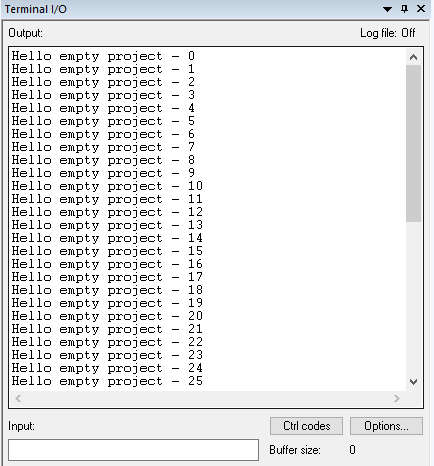
You can also call the scanf function to read from the Terminal I/O.
Performing trace on Keil μVision
Import the ModusToolbox project into Keil μVision
To export the project from ModusToolbox™ to Keil μVision, do the following:
- Open modus-shell and navigate to the Empty App application directory.
- Run the following command:
C make uvision5 TOOLCHAIN=ARM
To import the project into μVision, do the following:
Open the Empty App directory in file explorer.
Double-click the *.cprj file. This launches the Keil μVision IDE. The first time you do this, a pack installer dialog box will appear.
Follow the instructions on the screen to install the Infineon::PSoC6_DFP pack (v1.3 or higher). This pack can also be installed separately by launching the Pack Installer tool in μVision. The project will be created in the project window.
Right-click the project and select Options for Target ‘<application-name>’.
Select the Device tab. Depending on the kit you are using, select the relevant PSoC™ 6 MCU device under Infineon list.
For the CY8CEVAL-062S2 kit, select . Click OK.
Repeat the previous step and select . Click OK.
At this point, you should see a folder named “DebugConfig” created in your Empty App project directory. The DBGCONF files in this folder contains the TPIU port selection information.
Open the project options again.
Select the C/C++ (AC6) tab and do the following and click OK:
Set Language C to c99.
Set Warnings to AC5-like Warnings.
Set Optimizations to -Os balanced.
- Right-click the project and click Build Target.
Configure the debugger script and debugger
The debugger configures the TPIU port and necessary clocks before starting the trace. The PSoC6_DFP pack has the necessary files to perform this configuration. As explained earlier, the DBGCONF files in the DebugConfig folder located under the project directory has the TPIU port selection information. The default value for the TPIU port is usually not applicable for all development kits; therefore, the DBGCONF file must be edited to choose the correct TPIU port.
As seen in the Development board section, the trace data pins are routed to Port 9 of the kit.
Do the following to override the default values in the DBGCONF file:
In μVision, select . Navigate to the DebugConfig folder in the Empty App project directory, select the CM4 DBGCONF file, and click Open.
On the editor that opens with the file content, at the bottom of the editor, select Configuration Wizard.
Figure 16. Opening the DBGCONF file in Configuration Wizard 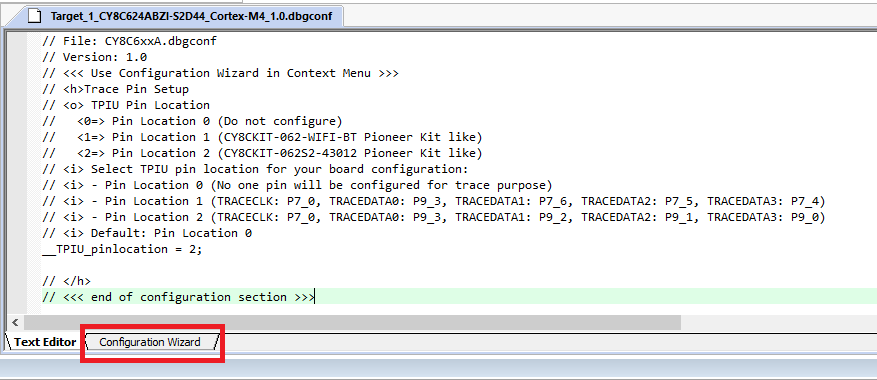
Select from the drop-down list. Details about the drop-down options are given at the end of the editor. Close the file once the selection is complete.
Figure 17. Editing the DBGCONF file in Configuration Wizard 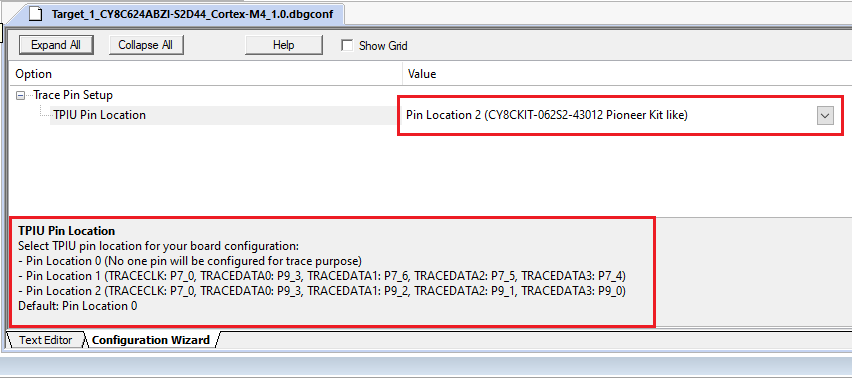
To select and configure the debugger in μVision, do the following:
\Open project options.
Select Debug tab. Select the debugger as ULINK Pro Cortex Debugger from the drop-down menu. Click the Setting button next to it.
Figure 18. Configurations in Debug tab 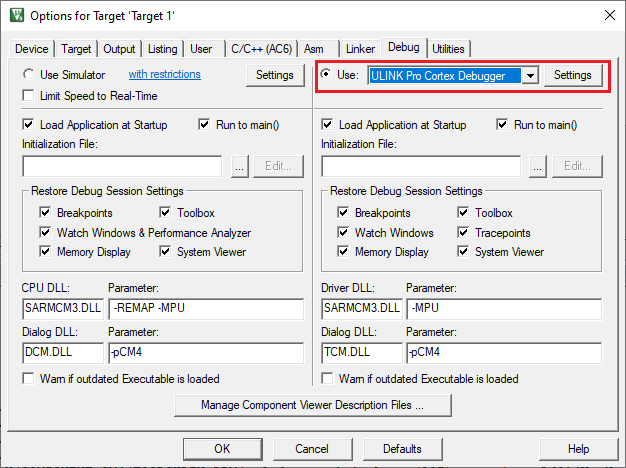
In the new window, match the settings of the Debug tab as shown in the following image:
Figure 19. Configurations in Debug > Debug tab 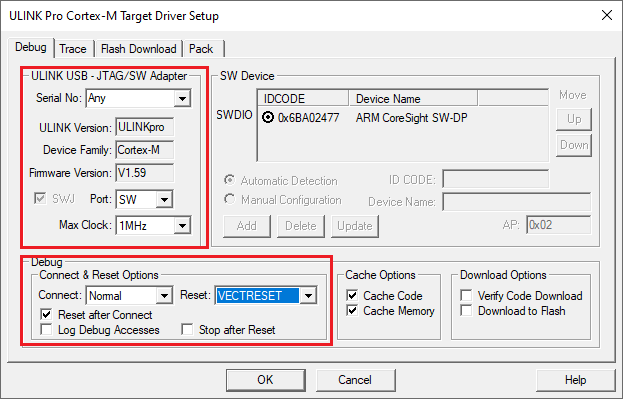
Select the Trace tab and match the setting as shown in the following image:
Figure 20. Configurations in Debug > Trace tab 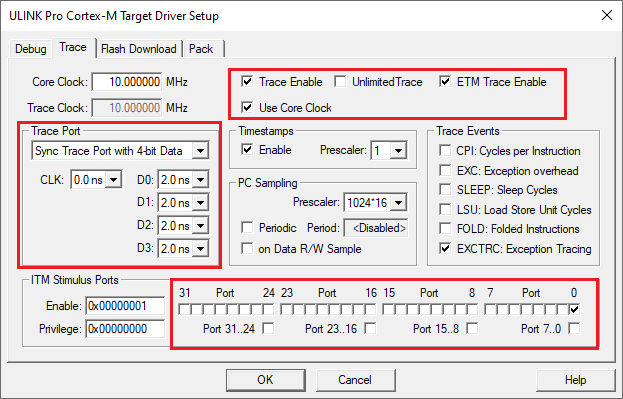
- Select the Flash Download tab, select the check boxes for Program, Verify, and Reset and Run.
- Select the Pack tab, and select the Enable check box. Click OK.
Perform ETM trace
In the main.c file, modify the code as per Code Listing 1 in the Perform ETM trace section. This will toggle the user LED on the kit every second.
To start ETM trace, do the following:
- Click the Build icon on the μVision toolbar to rebuild the code.
- Click the Start/Stop Debug Session icon on the μVision toolbar to program the image and start the debug perspective.
- Select to open an ETM trace window.
- Click the Run icon on the toolbar to start the execution and collect the ETM trace data.
You should see the user LED toggling every second. If you pause the trace, the trace data collected will be populated in the ETM trace data window as shown below:

The ULINKpro debugger will automatically calibrate to the new trace clock if the trace clock changes during code execution.
Perform ITM trace (printf-style debugging)
To configure for printf-style debugging, do the following:
- In μVision, launch the Manage Run-Time Environment window.
- Select , and then select the check boxes for STDIN and STDOUT. In the drop-down list for STDIN and STDOUT, select ITM.
- In the main.c file, modify the main function and header list per Code Listing 2 in the Perform ITM trace (printf-style debugging) section.
To start trace, do the following:
- Click the Build icon on the μVision toolbar to rebuild the code.
- Click the Start/Stop Debug Session icon to program the image and start the debug perspective.
- Select .
- Click the Run icon on the toolbar to start the execution and collect the ITM data.
You should see the user LED toggling every second. The Debug Viewer should display logs as shown below:

Summary
This application note explored the PSoC™ 6 MCU trace architecture and the associated developments tools. It also covered various general aspects of Arm® trace architecture. With this background, you should be able to understand and perform trace on PSoC™ 6 MCU to its full potential.
Although the application note limits itself to showcasing the ETM and ITM trace, third party tools in general offer a wide variety of other trace features such as function profiling, data watchpoints, interrupt logging, and code coverage. You can refer to the respective tool documentation to understand all the features they offer and use them effectively for complex embedded application debugging and development.
References
Revision history
| Document version | Date of release | Description of changes |
|---|---|---|
** | 2022-09-22 | Initial release. |
*A | 2022-12-09 | Section 3.1.2 - Added a note and fixed errors. |
| *B | 2023-08-17 | Updated link references |